I know what your Electron app is doing
Earlier this week, my partner found that a desktop application she regularly uses to transcribe her podcast recording files was not working. After spending a frustrating hour of searching on the web, digging through help pages on its website, retrying the transcription, restarting the app, and rebooting the laptop (“Have you tried turning in off and on again?”), she finally threw her hands up and submitted a “request” for help to the product team detailing the situation as well as her efforts to get it work.
Unfortunately, the response she received was, to say the least, unsatisfying. In sum, the response was, “it’s probably your home WiFi.”1 B-but, we had no problem joining video meetings, watching YouTube videos, surfing the web, etc. the whole time! So that evening, my little journey began—a rigorous detective work to figure out exactly what the heck is going on with this piece of s…oftware. 😤
The first key observation I made was that this was an Electorn app. Hey, the download link was literally on a electron subdomain! This means it’s running on Chromium.
Accordingly, my very first instinct was—and this sort of shows my lack of experience with Electron—to press Ctrl + Shift + I or F12 to open up the DevTools and check for the network traffic. The idea was, if I could see the requests it’s making and the responses to those requests, I would be able to get a better idea of what’s going wrong. Of course, the DevTools didn’t show up, since the DevTools could easily be disabled by the Electron app developer. And, for any real-world-facing production app, user’s ability to open the DevTools is understandably an undesirable behavior.
My next approach was to find a way to catch and monitor all HTTP traffic for my machine. So I opened Windows 10 Resource Monitor, hoping that maybe it would display some information on HTTP calls by all the running processes. Sadly, this turned out to be not the case: Resource Monitor indeed showed what processes were having network activities and some more details (used ports, established TCP connections, etc.). HTTP traffic was not part of it.
After a bit of web searching, I learned that Postman could be used as a proxy to monitor HTTP requests. Unfortunately, I just couldn’t get it work properly. Then I found an alternative called Fiddler,2 which worked out of the box without setting up a proxy server or anything. With Fiddler, I was finally able to see all the HTTP requests the transcribing app was making to its backend services as well as the corresponding responses. No, the issue was not my WiFi connection. 😈
At this point, I already got what I wanted, i.e. taking a peek inside the HTTP calls this app was making. But using Fiddler, it was a little difficult to isolate just those calls from other HTTP requests all the other processes were making. (This, again, could be just me not knowing its UI well.) I thought to myself, “It’d be really good if I could just look at the HTTP calls by this Electron app I’m interested in…”
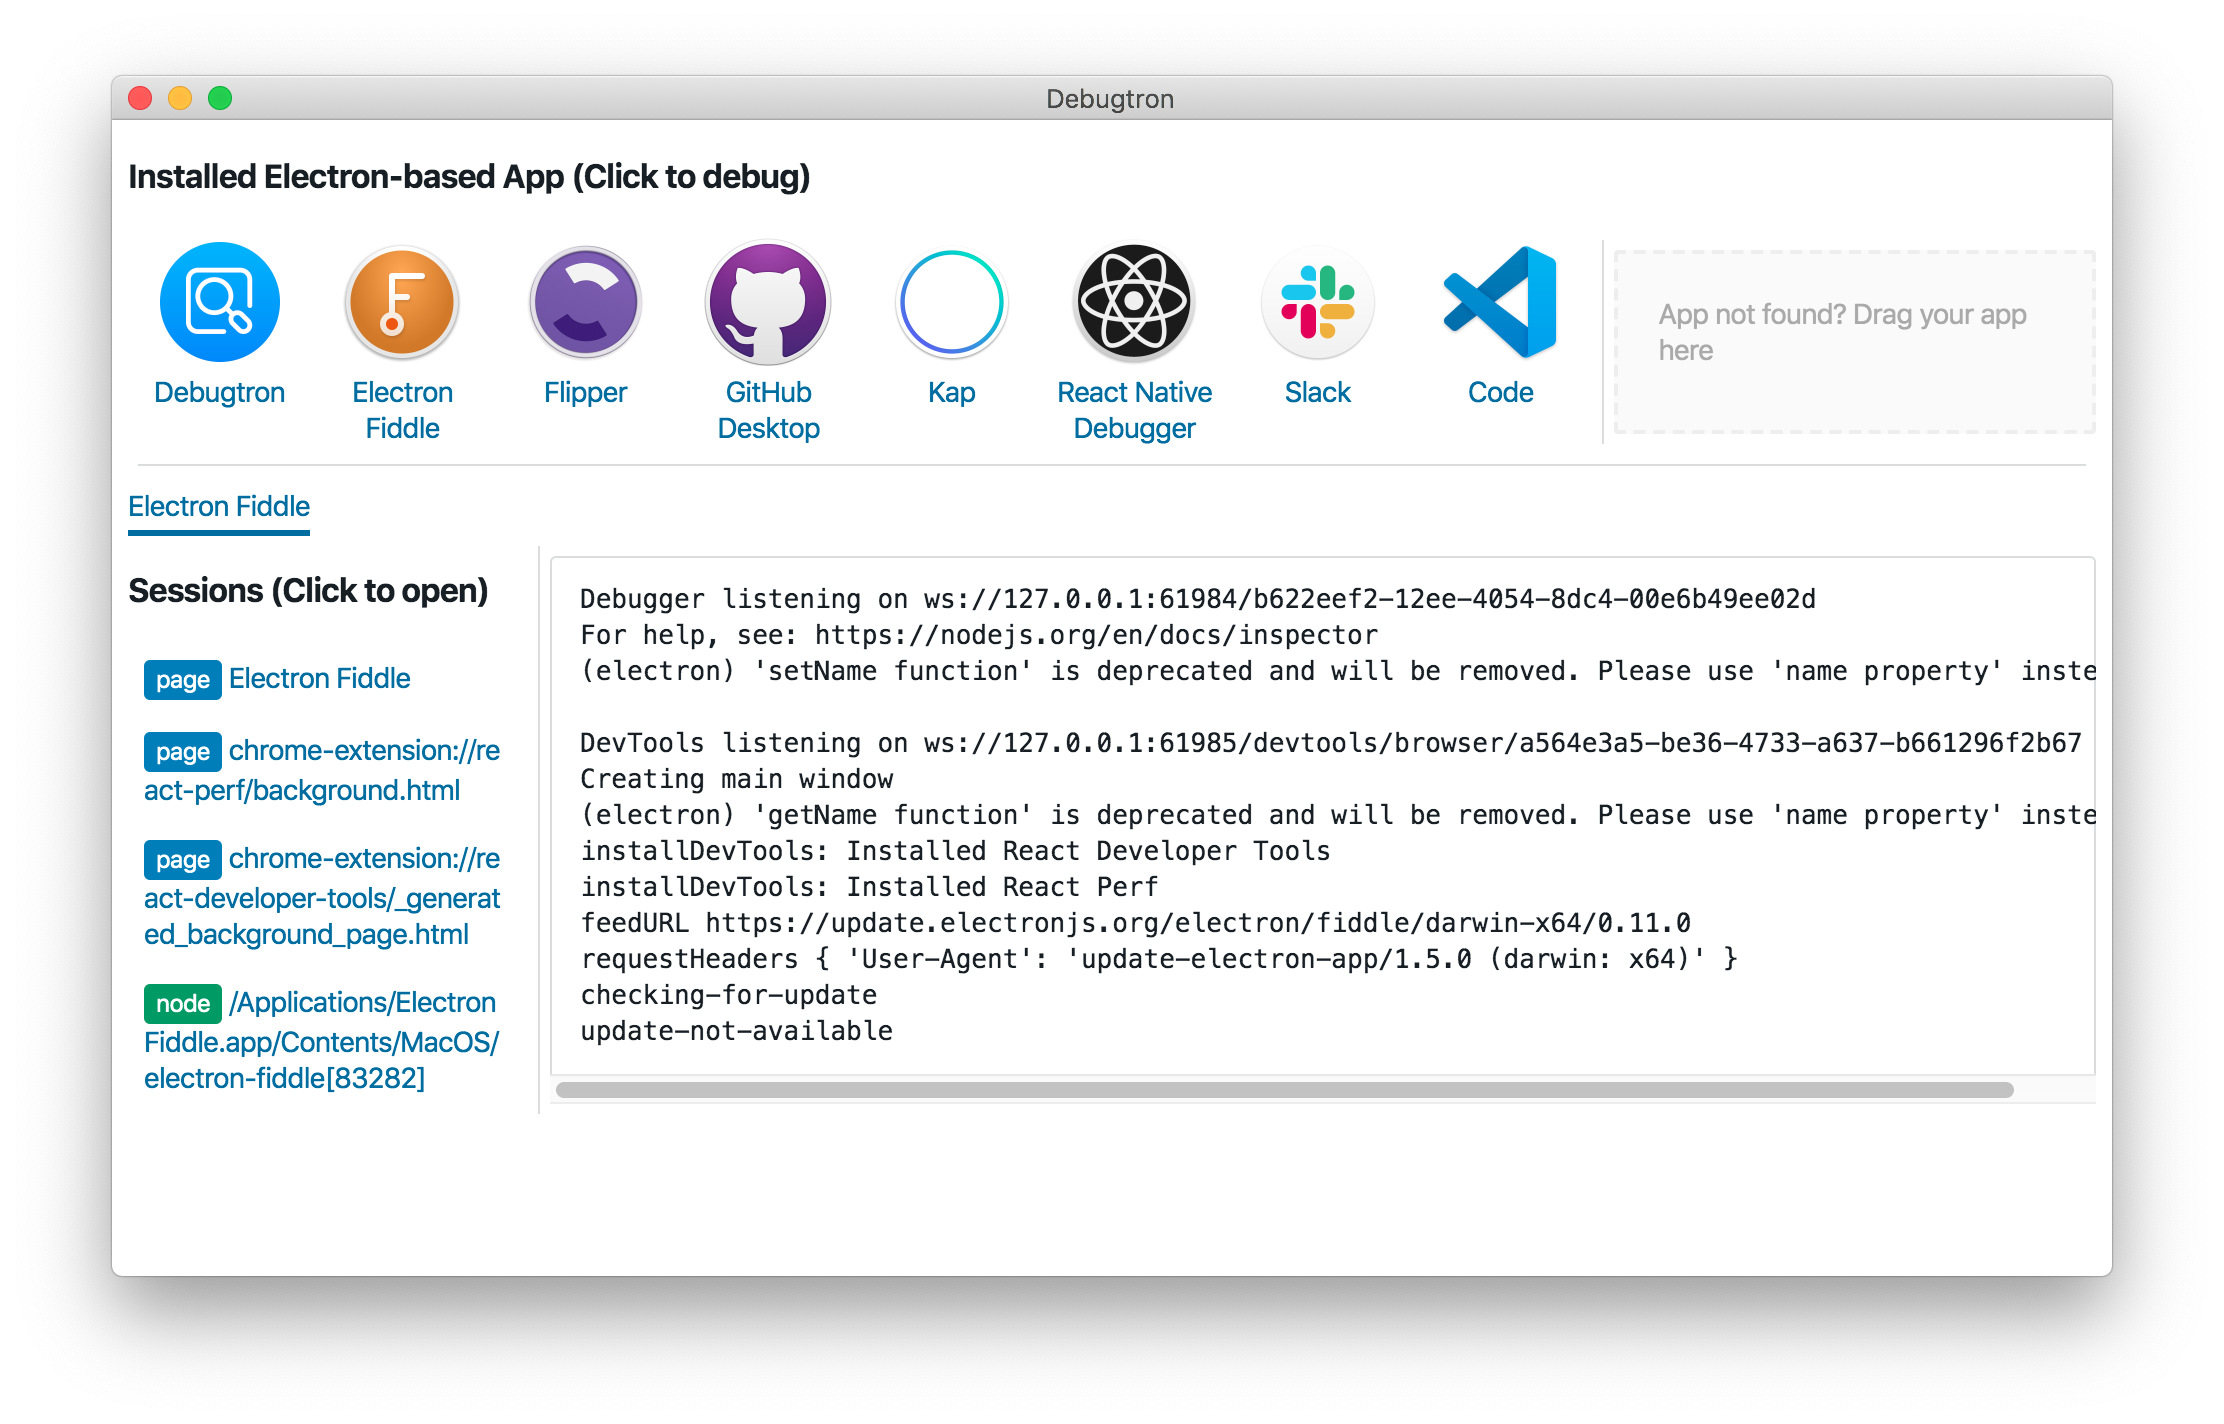
Well, turned out, I could! By a sheer fluke, I came to the bytedance/debugtron GitHub repo. (Yes, that ByteDance.) The README said, “Debugtron is an app to debug in-production Electron based app. It is also built with Electron.” And the executable was available on the page for each release.3

It didn’t take me much to realize that this was what I had been looking for all the evening. Upon starting, Debugtron detected and displayed on the top bar all Electron apps installed on my machine. When I clicked the transcription app, Debugtron launched the app and showed the running sessions on the side panel and log on the main panel. Then I could inspect each session, which would finally give me back the DevTools with their full capabilities. It being an open source is a cherry 🍒 on top.
Later that night, I helped my partner to draft a reply to the support team with all the details I gathered from a peek inside their app. Ultimately, the issue was resolved by a new version of the app that got released the very next day, and my partner was able to get back to her podcast production. Given the short time between the reply and the new release, it is likely that the fix was already part of the scheduled release. But I’d like to think that my feedback played a small role in making their product better. 🤩
Footnotes
-
The actual content of the email might have been simply a prepared response for common cases. And I am sure that there are many people coming to them with silly complaints… ↩
-
The Fiddler website is pushing for a SaaS version of the product called Fiddler Everywhere. For a “traditional” version that just works after install, I had to look for what they call Fiddler Classic. ↩
-
The latest release at the time of this writing was for v0.5.0. ↩